The Creator
Economy Map
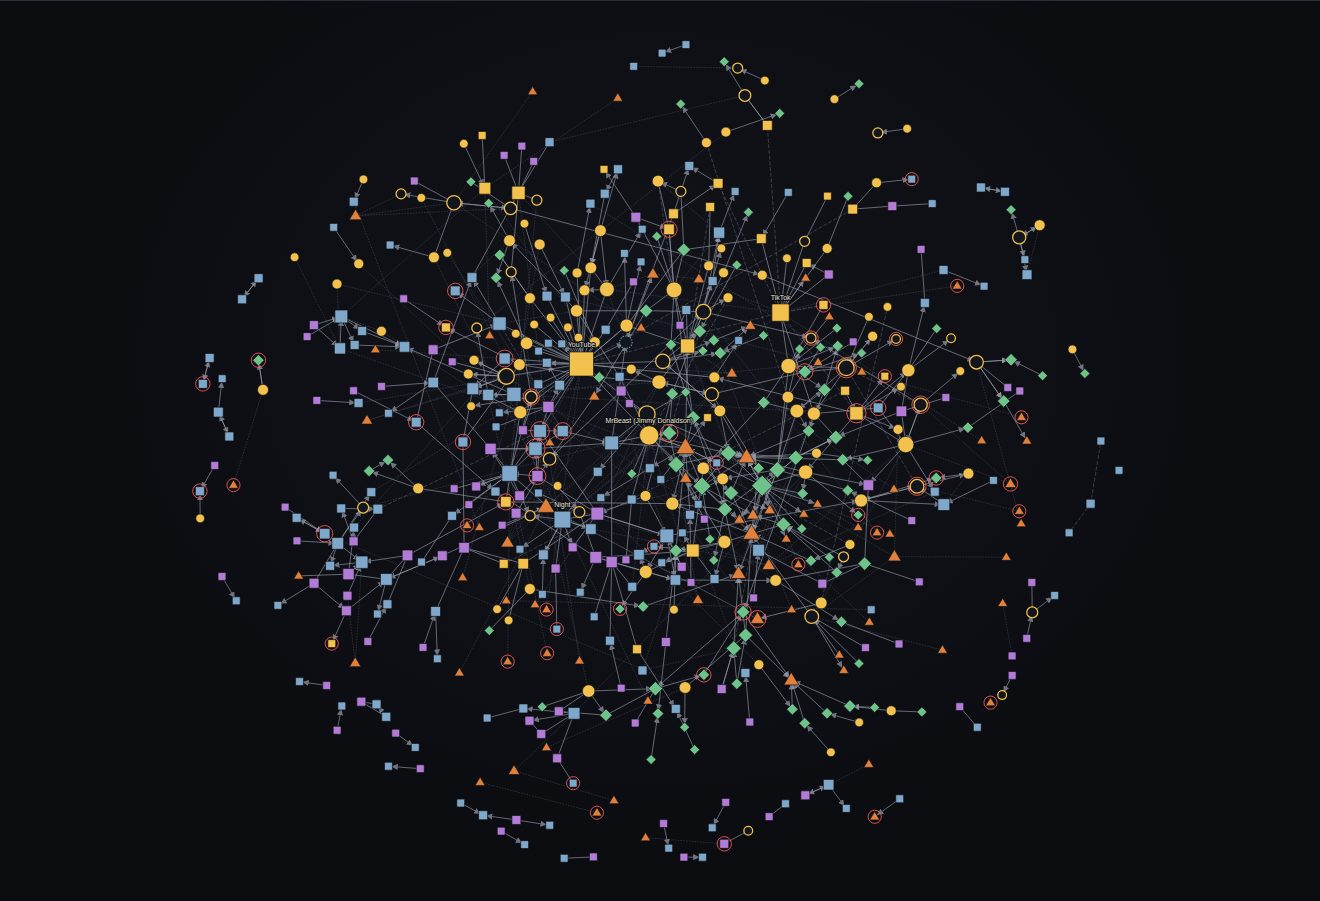
How attention becomes brand partnerships, owned products, retail shelves, factories, jobs and places across the United States, 2005 to 2026, with the failures mapped at the same standing as the successes.
Work in progress. This map is not exhaustive. It presents the result of documented research at this release and changes as sources are added, corrected, or superseded. Every node is based on at least one public source and carries its sources and confidence class. If something is missing or wrong, submit it.
Public disclosure policy: This map uses public business records, public corporate filings, property records, public calendars, public civic documents, public press coverage and public listings. It maps commercial infrastructure and documented civic activity, not endorsements, partnerships or private cultural behavior. Inclusion does not require participation, consent or approval. The map corrects factual errors promptly and considers removal requests case by case where a listing is outdated, an entity has closed, publication presents a material safety concern, or the entity is not conducting public facing commercial activity. Public commercial infrastructure is mappable; private cultural behavior is protected.
Open the interactive map Read the reference
574 creators, companies, brands, places and funds · 801 connections · 5 layers · 28 metros
Version 1.3.3. Data current through September 2026. Activity after that date is described as announced or scheduled, never as completed.
Read the reference
The same text as the PDF, generated from the same data file as the map, so the counts never disagree.
Value moves, and it leaves a trail
What the nodes and lines mean, the five layers, the three weights of connection and why failures stand equal to successes.
Six rungs from attention to a local economy
The six rungs every complete path shares, with MrBeast, Prime, Michelle Phan, Emma Chamberlain, Dude Perfect and the Sidemen as the worked cases.
The MCN era and what replaced it
Maker, Fullscreen, Machinima and Defy, the buyers who paid for them, and the agencies, management firms and tools that replaced the network model.
Where the rungs break
Each layer has a characteristic failure, and every closed, dissolved, bankrupt or wound down node names the rung that broke.
Where the goods, jobs and events land
Where the goods, jobs and events physically land, metro by metro, which is rarely where the creator lives.
What a city can capture
The local capture metric, the failure mode matrix and what a city can do at each rung.
The manufacturing and retail rungs, edge by edge
Every manufacturing and retail placement edge on the map, listed edge by edge.
Confidence, dates and sources
Confidence, source tiers, timing types, timeline placement and the flagged discrepancies.
Index of nodes
Every node on the map by layer and year of entry, each with its own entry page.
Current cases: how attention becomes goods, jobs and places
Five paths singled out because each shows a different route from an audience to an operating business. Node size and centrality are computed, not adjusted.
MrBeast: attention to chocolate
The complete ladder in one path: AdSense, a first sponsorship, management, a licensed name, an owned brand, a Peruvian factory, Walmart shelves and a holding company run from Greenville, North Carolina.
Prime: the manufacturing rung
Two creators, a Louisville operator that holds the majority, a dedicated bottling line in Missouri that never got orders, and a sales fall that shows where the manufacturing rung breaks.
Michelle Phan, Kylie Cosmetics and the beauty template
The first major brand deal for a YouTube beauty creator, the subscription box that came out of it, and the template Kylie Cosmetics scaled to a Coty exit.
Emma Chamberlain: the small brand that shows the middle rungs
A small brand that shows the middle rungs clearly: agency, ambassador deal, owned coffee brand, retail placement and outside capital.
Dude Perfect and the Sidemen: collectives that became companies
Two collectives that became companies with headquarters, tours, restaurants and outside investment, in Frisco and London.
Five layers
Every node sits in one layer of the economy. Open any layer in the index of nodes.
Most embedded in this dataset
Embeddedness is the count of documented connections a node carries. Full index.
- YouTube platform · 48 connections
- MrBeast (Jimmy Donaldson) creator · 20 connections
- TikTok platform · 20 connections
- Night agency · 18 connections
- Prime Hydration brand · 17 connections
- Rooster Teeth media company · 15 connections
- Amazon retailer · 13 connections
- Jake Paul creator · 12 connections
- Dude Perfect collective · 12 connections
- Ninja (Tyler Blevins) creator · 11 connections